Thursday, November 5, 2009

Ok boys and girls, now seriously!


I was out for some time, but now I am back for the main reason: WE HAVE TOP on Oct.21 and yesterday or early today we will have another top, but this time lower top with a massive sell-off after that. I sold some SPX minis, and if market today will be generous I will go all in.

Thursday, May 21, 2009

Impulsive VS. Corrective (BKX)

If you are familiar with Elliott Waves, you will notice that recent "down-up" move looks like the first one was impulsive and second one looks like corrective wave. Next move has to be impulsive, if so that means that correction, started from 11/05 is impulsive too. So the probability, that just started 5th wave to finish Primary 1 is growing (primary counting in pink).
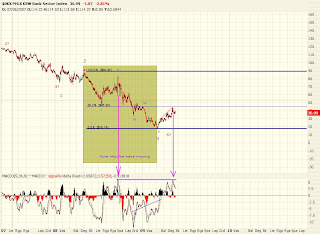
Also worth to mention, that latest MACD extreme point apears to be in the same level as in 09/19/2008. After that we saw huge sell-of.


Financial sector did too big rebound from march lows. Thats not the case in bottoming process. I mean usually thous sectors witch led to bear market recovers almost the last. So, if this is just bear market rally (I personally have no doubt about it), financial sector should lead sell-of. Soon we will see.

Monday, May 18, 2009

Upside Potencial

Today I think we have some upside potential, but I could say very small. In my point of view there are two alternative short term interpretations: S&P 500 index could be in iii of 3 of (B or X) with one more up-down missing to complete wave 3 of (B or X). Another look tells that wave 3 of (B or X) might be already finished, but it's less likely, because that wave would be relatively small compared to "i".
I will concentrate on more likely scenario: today's move could be wave "iv" of 3 of (B or X). We have resistance at 888,58 line, where probably ended wave 1 of 3, and recently we are trading in channel, which moves down. Watch the upper line for resistance.

Friday, May 15, 2009

You must be patient if you want to seek your goals


Lets take a look at S&P 500 index. Yesterday we rebounded after sell-off day before. But thats OK. If we take Elliott Wave Principles we actually needed that rebound to continue larger grade decline. From march lows I think that we are witnessing some kind of much more complicated Primary 2 rally than simple a-b-c. One part of that correction may be finished. Now we are going to form another part, and my primary guess is that it will be double zig-zag or abc-x-abc.
At smaller time frame (60 min. chart) you can see where index stopped yesterday: exactly at 50% fibonnacci level (drawn from 05/12 2:30 PM to 05/14 9:30 AM). That's common at corrective patterns, but not the rule. We still can go up to 61.8% or 78.6% or even 100% levels. But modified MACD shows that hourly move is loosing stream. Plus, connecting recently reached lower highs we got downtrend channel, which stopped index yesterday too.
So, we have broken uptrend chennel, we have clear EW waves, we have common fibonnacci levels and moving down MACD indicator. Next move could be iii of 3 wave, which should be powerful and quick, possible with gaps down or something else. A brake below 882.52 would indicate that this correction is resuming and will lead index to lower lows.

Thursday, May 14, 2009

Watch the channel!


We definitely will know soon thats next for financial sector. Fibonnacci level stopped rising channel, now its time to test lower line of it. My clue is if we broke below that line, we will see more correction, perhaps firstly to 550-560 area. It's amazing how perfectly lines are symmetric if you draw them on extreme points, so something has to happen.

And one more thing: yesterday RIFIN stopped just on 20 EMA. So broking this level would be big improvement for deeper correction.


Wednesday, May 13, 2009

Target


Do you need more evidence for at least short term pullback? First, index couldn't broke above 200 MA, second, Bollinger Bands was the limit for at least past two times, and third, MACD histograma is turning down. In my opinion we will touch middle line at 35.67. That is my target point for FAZ units exit.

Smaller time frame


And here it is much more clearly picture. We got nice MACD confirmation, we got pullback from 38.2% fibonnacci level. Question is: can this trend last longer? Or we gona reach upper fibonnacci level (50%;61.8%).
I bought some FAZ ETF in premarket, mostly because of modified MACD.

Fibonnacci level

Above you see weekly BKX Philadelphia Banking Index. Its amazing how great here fits Fibonnacci levels.

Tuesday, May 12, 2009

Financial sector

Very important key level holds for second day. Financial sector shows some kind of weakness and might be alerting something big is coming. As blue chip indexes they have rebounded significant, but my MACD and volume wants at least pullback. If MACD histogram turns negative I will try to short financial sector.